Dew point is a critical metric in atmospheric science and everyday weather observation. It measures the temperature at which air becomes saturated with moisture and dew begins to form. The dew point chart is a practical tool used in weather forecasting, HVAC system design, and industrial applications to quickly determine moisture levels and condensation risk based on temperature and relative humidity.
While relative humidity fluctuates with temperature, the dew point provides a consistent indicator of moisture content in the air, making it highly valuable for technicians, engineers, meteorologists, and facility managers.
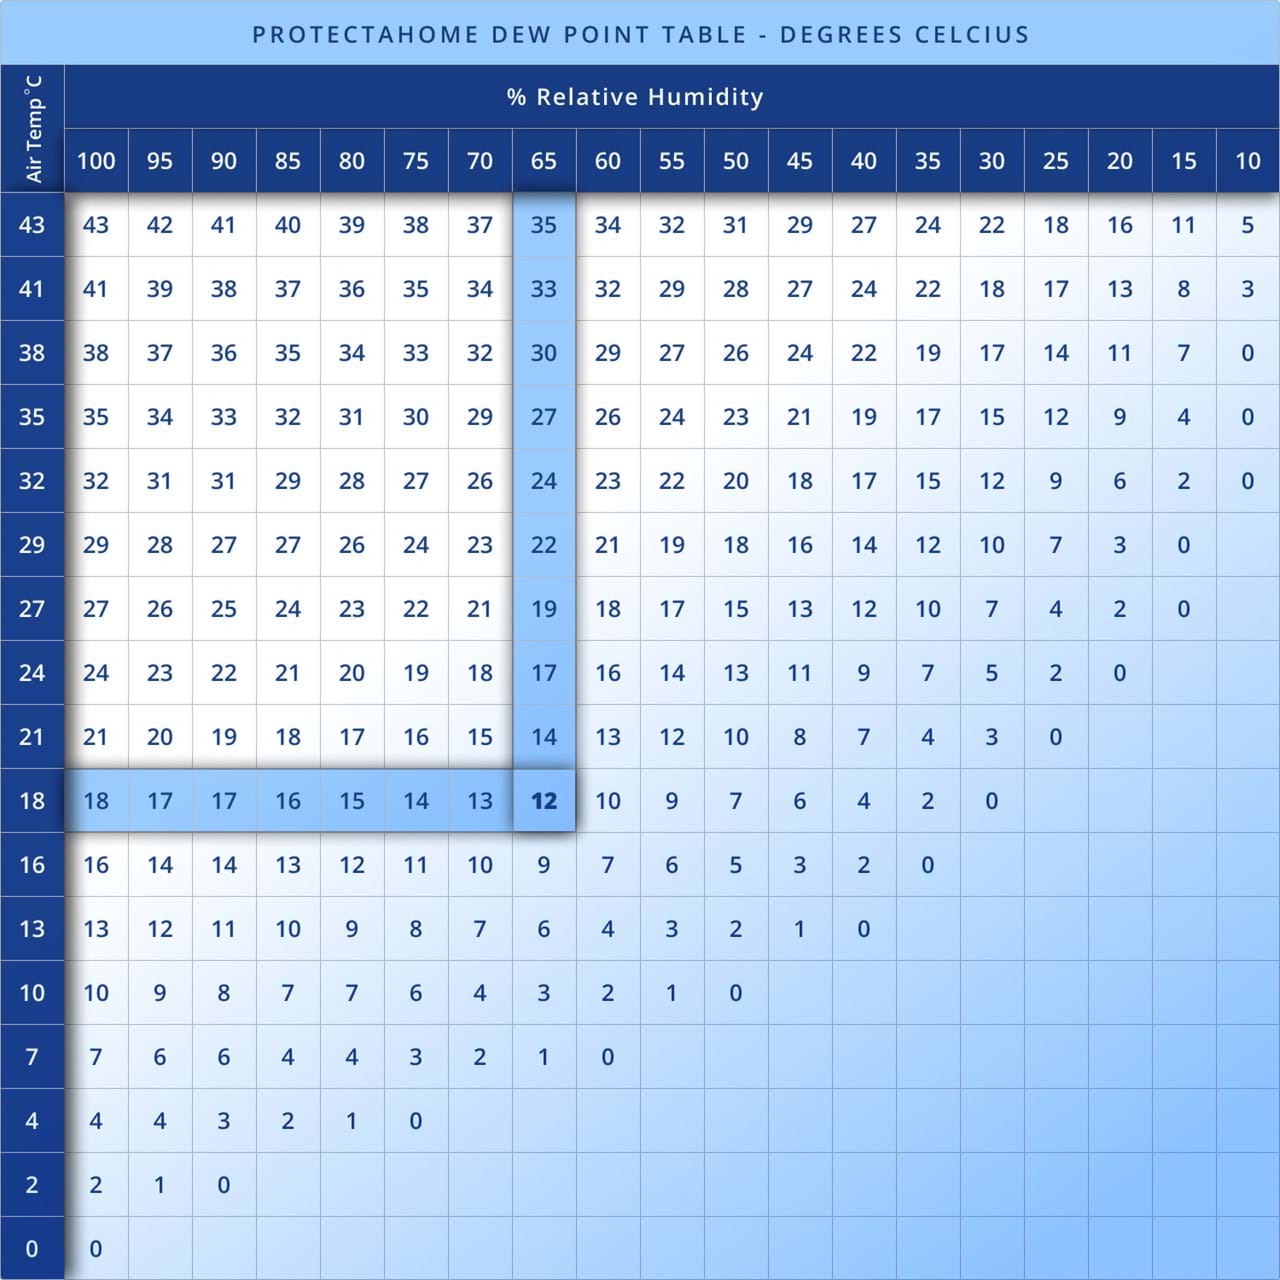
What Is a Dew Point Chart?
A dew point chart is a visual reference tool that correlates air temperature and relative humidity to determine the dew point temperature. It’s typically formatted as a grid or table where users can cross-reference temperature values (°C or °F) with relative humidity (%) to find the corresponding dew point.
These charts simplify complex calculations and are often used in:
- HVAC system calibration
- Meteorological forecasting
- Moisture-sensitive manufacturing
- Agriculture and greenhouse control
- Aviation and military operations
How the Dew Point Chart Works
Basic Parameters Involved
A typical dew point chart uses:
- Dry-bulb temperature (ambient air temperature)
- Relative Humidity (%)
- Dew Point (°C or °F)
To use the chart:
Locate the current air temperature on the horizontal axis.
Locate the current relative humidity on the vertical axis.
Find the intersection point of these two values.
The intersecting cell shows the dew point temperature.
This straightforward process eliminates the need for manual calculations or digital tools, especially in field operations or educational settings.
Benefits of Using a Dew Point Chart
Quick Decision Making
In industrial and HVAC settings, time is critical. Dew point charts provide a rapid visual tool for understanding air moisture conditions without requiring electronic devices.
Improved Accuracy in Environmental Control
A dew point chart allows for more precise humidity control, reducing the risk of:
- Mold growth
- Condensation
- Corrosion
- Product spoilage
Easy to Use in the Field
Technicians in remote or rugged environments may lack access to reliable power or devices. A printed or laminated dew point chart remains a durable, practical alternative.
Educational Tool
Dew point charts, used in science classrooms and training centers, help visualize meteorological principles and promote a better understanding of psychrometrics.
Applications Across Industries
HVAC and Building Management
Accurate dew point control ensures occupant comfort and prevents issues like window condensation, damp walls, and microbial growth. Facility managers use dew point charts to maintain ideal indoor conditions.
Agriculture and Greenhouses
Farmers and horticulturists monitor dew points to anticipate dew formation, frost risk, and to regulate irrigation systems based on evapotranspiration levels.
Data Centers and Server Rooms
Maintaining a safe dew point prevents moisture buildup that could damage sensitive electronics and cause downtime.
Pharmaceuticals and Cleanrooms
Strict humidity control is essential to preserve product quality, prevent contamination, and ensure consistent testing conditions.
Aviation and Aerospace
Pilots and flight engineers assess dew point to anticipate fog, icing conditions, or storm development, particularly during takeoff and landing.
Limitations of Dew Point Charts
While dew point charts are helpful, they do have some limitations:
Static Information
Charts are based on assumed conditions (e.g., sea-level pressure). Values may require correction in high-altitude or variable-pressure environments.
Limited Precision
For applications requiring high accuracy (±0.1°C), digital sensors and calibrated hygrometers are preferred over static charts.
Not Ideal for Dynamic Environments
Real-time sensor-based monitoring is more effective than referencing a static chart in spaces where temperature and humidity fluctuate rapidly.
Dew Point vs. Wet-Bulb Temperature
It’s common to confuse dew point with wet-bulb temperature, but they serve different functions:
- Dew point is the temperature where water vapor condenses.
- Wet-bulb is the lowest temperature that can be achieved through evaporative cooling.
Both are used in psychrometric charts, which combine multiple variables (humidity, enthalpy, dew point, wet bulb, etc.) to give a fuller picture of air conditions.
Digital Alternatives: Dew Point Calculators
Although charts are valuable, dew point calculators—digital tools that automate the process—offer additional benefits:
- Input temperature and RH directly
- Get instant dew point in °C/°F
- More precise and versatile
- Can adjust for pressure and altitude
Standard digital tools include:
- Online calculators (e.g., National Weather Service, Omnicalculator)
- Mobile apps for HVAC technicians
- Embedded tools in building automation systems
How to Read and Interpret a Dew Point Chart Effectively
To use a dew point chart efficiently:
Measure the air temperature using a thermometer.
Measure relative humidity using a hygrometer or psychrometer.
Find where these two values intersect on the chart.
Use the resulting dew point value to:
- Assess risk of condensation
- Determine comfort levels (above 16°C is muggy)
- Adjust ventilation, dehumidification, or air conditioning
For example, if the room temperature is 25°C and RH is 70%, the dew point is 20.4°C—a condition that could cause condensation on cooler surfaces.
Creating Custom Dew Point Charts
For advanced users, it’s possible to generate custom dew point charts using:
- Excel or Google Sheets
- Python or MATLAB scripts
- Psychrometric software tools
This approach allows:
- Inputting actual pressure values
- Creating localized charts for specific climates
- Visualizing trends over time
Conclusion
The dew point chart remains an indispensable tool for meteorology, engineering, and building management professionals. It simplifies the science of humidity and provides a quick-reference solution for assessing environmental conditions.
Though digital sensors and calculators are rising, traditional dew point charts still hold immense value, especially in fieldwork, education, and backup scenarios. By understanding how to interpret and apply these charts, individuals and businesses can optimize climate control, improve safety, and enhance comfort in virtually any environment.